Lab 1 - Introduction to R Studio
R Studio Basics
Contents
- Creating variables
- Descriptive Statistics (summary, IQR, SD)
- Creating plots (histogram, scatterplot, boxplot)
- Formatting plots and graphics
- Loading a csv file
- Installing a library
- Describing with psych library
Variables and Basic Descriptive Statistics
Variables in R can be defined either by using the format (variable name) <- (value).
See the example below:
numbers <- c(1,2,2,3,3,3,4,4,4,4,5,5,5,5,5)
Once you have defined the values and run the line, you can then use the variable name to describe your values. Run each of these lines for a summary, standard deviation and interquartile range of your values:
summary (numbers)
sd (numbers)
IQR (numbers)
Loading csv Files
A csv file is a file of comma separated values. Once loaded into R studio you can then visualise the data by selecting it in the environment tab.
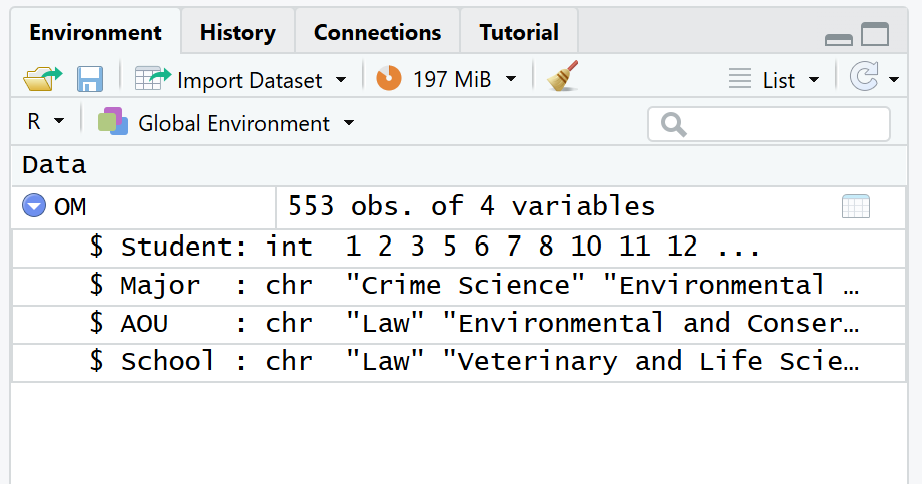
For example, I have loaded the OurMajors.csv file and named the variable OM for short. Run the following command to do so, then find the desired file.
# Variable name comes first, then the command.
# You can change the variable name to whatever you like

OM <- read.csv(file.choose())
Each column of data is represented beginning with $. If you wanted to make a table of the school each student from the subject is enrolled in for example, you would run the following:
table (OM$School)

# run the following to turn the table into a named variable

tblSchool = table (OM$School)
View (tblSchool)
Creating Plots
Histograms
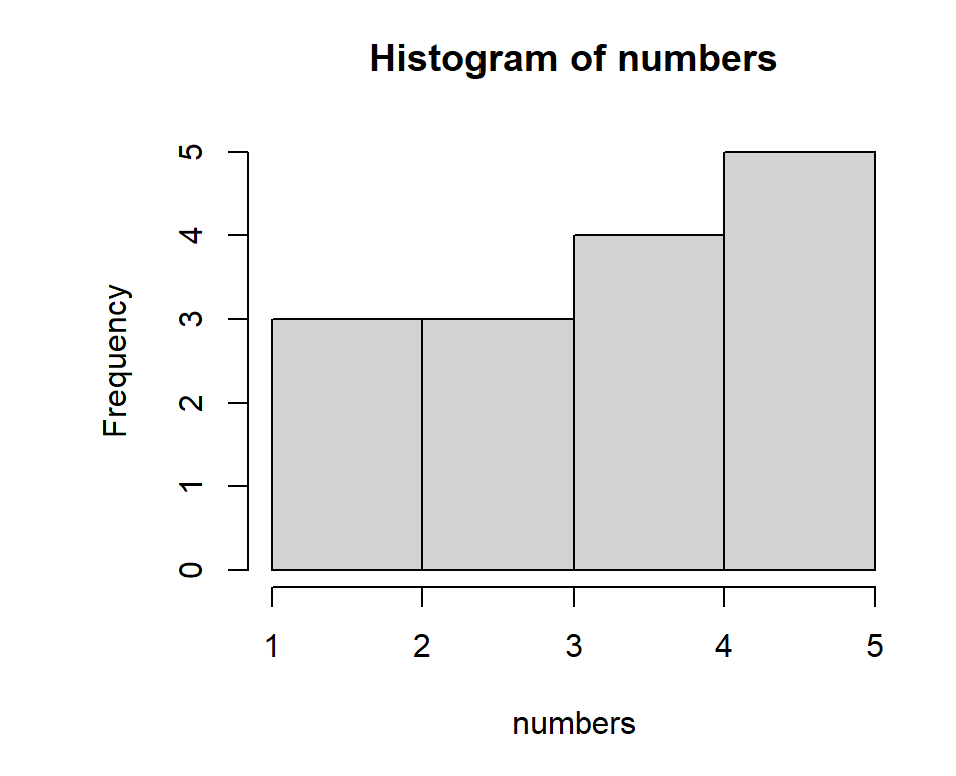
Histograms can be created from a set of variables quite simply with the command "hist" , for example this is a histogram created from the following variables:
numbers <- c(1,2,2,3,3,3,4,4,4,4,5,5,5,5,5)
hist (numbers)
Scatterplots
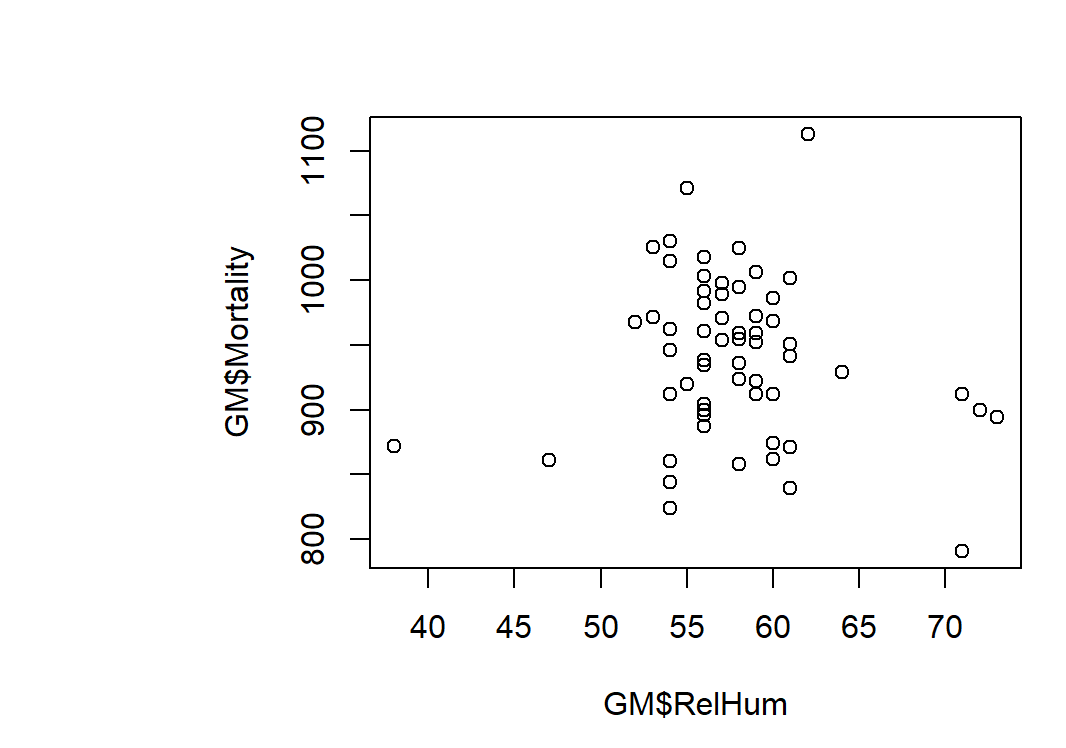
Scatterplots can be created with the following command:
plot (dataset$variableA ~ dataset$variableB)
Box and Whisker Plots
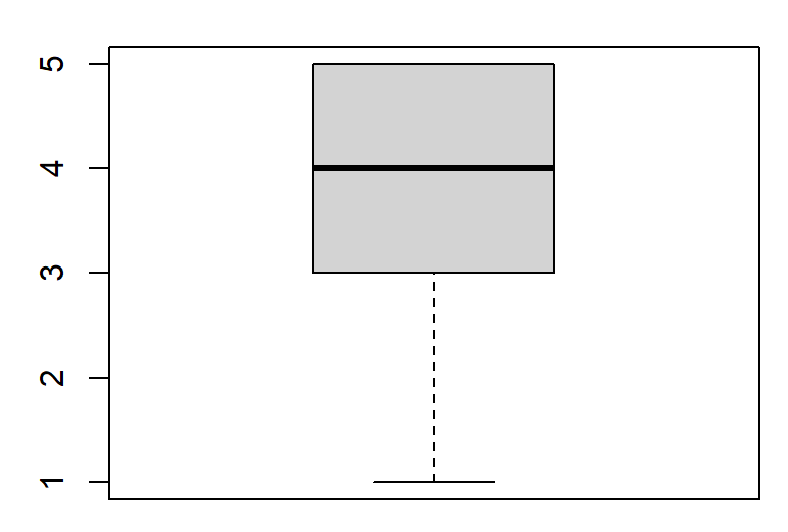
Box plots are created using the following command ("numbers" dataset used as an example)
boxplot (numbers)
Basic Plot Formatting
The following are commands for labelling and visualising:
hist(dataframe$column,
main = "Insert main title here",
xlab = "Insert x label here",
ylab = "Insert y label here"
las = 1, # changes y axis labels to vertical
breaks = manually selected breaks or delete to let R decide)

boxplot(dataframe$column,
main = "Insert main title here",
ylab = "Insert y label here",
las = 1 )

plot(dataframe$Ycolumn ~ dataframe$Xcolumn,
xlab = 'Insert x label here',
ylab = 'Insert x label here',
main = 'Insert main title here',
las = 1)
Installing a Library
To install a library, you can navigate to the packages tab, or you can install from CRAN using the following command:
install.packages("packagename")
You have to activate your library each time, use the following command to do so:
library ("packagename")
This lab uses the psych library and introduces the describe function:
