WK2 Lecture 1 - Scatterplots
Components
A scatterplot is a graphical representation that displays the relationship between two numeric continuous variables.
Components include:
- Data points - each point is a unit
- X axis - independent (explanatory) variable
- Y axis - dependent (response) variable
- Axes labels and title
Describing Relationships
The relationship between two numeric variables visualised in a scatterplot is described based on the direction, shape, and strength.
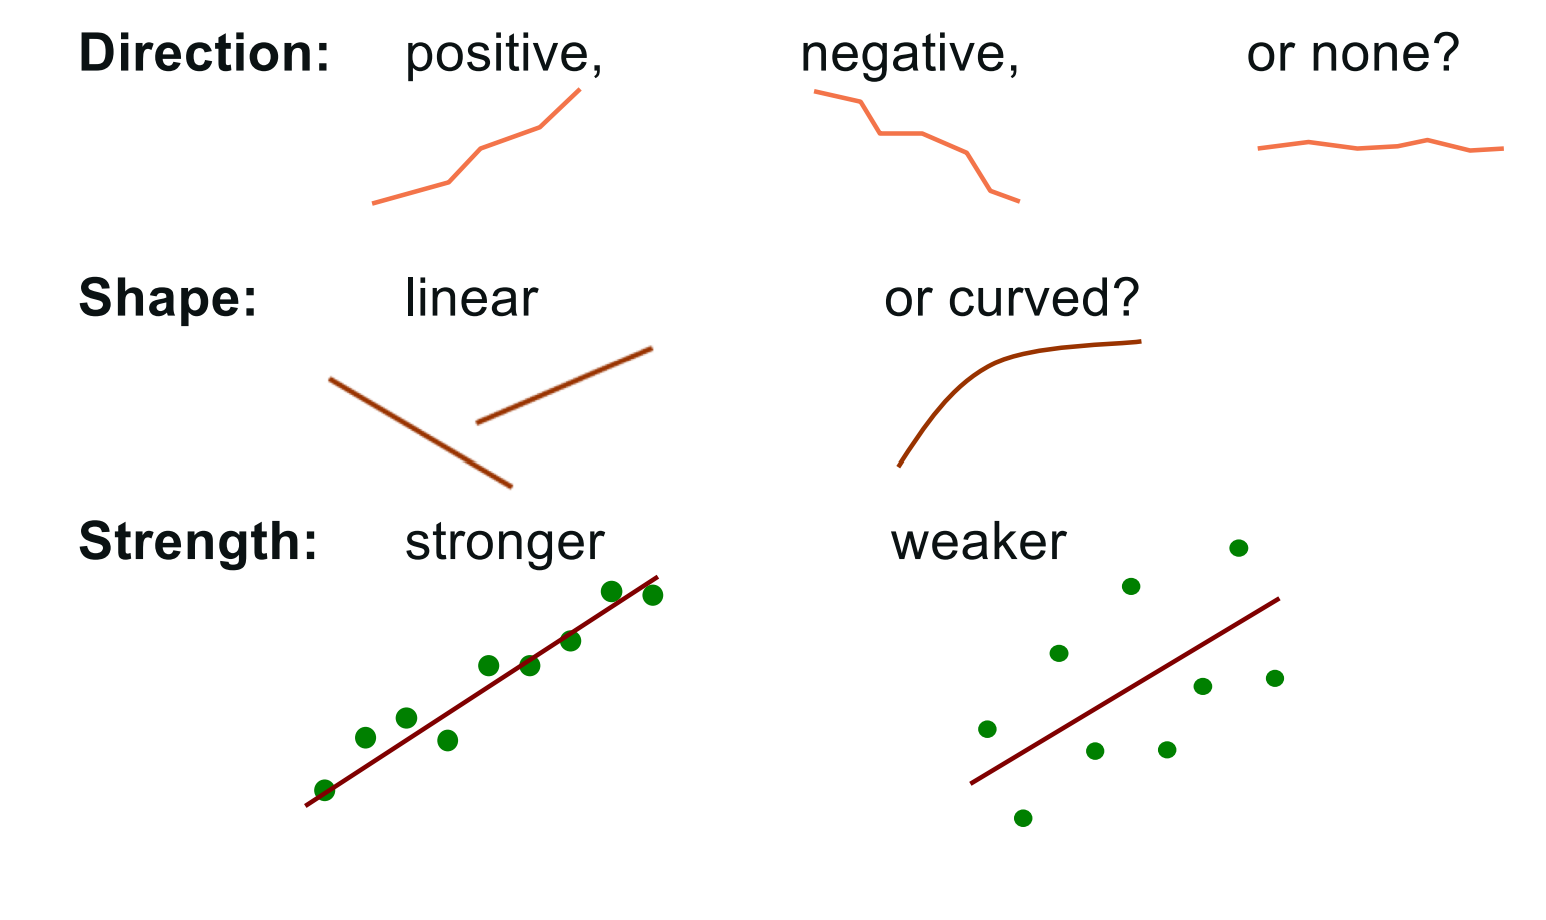
Investigating relationships (aka associations) requires statistical inference to understand if there's evidence of a relationship or not.
Correlation
A scatterplot is the visual component in identifying correlations and relationships between two numeric variables. The correlation coefficient
The equation for determining correlation coefficient is as follows:
However this is often not an efficient way of determining correlation, it can be calculated in r as follows
cor (DATASET$X-AXIS ~ DATASET$Y-AXIS)
or by looking for multiple R squared on a summary of the data, note that this gives strength but not direction.
Properties of correlation coefficients are:
lies between -1 and 1 if the relationship between x and y is a straight line as both increase if the relationship is a straight line as x increases and y decreases if x and y are not linearly related (no correlation, or quadratic relationship) indicates the slope and strength of the linear relationship
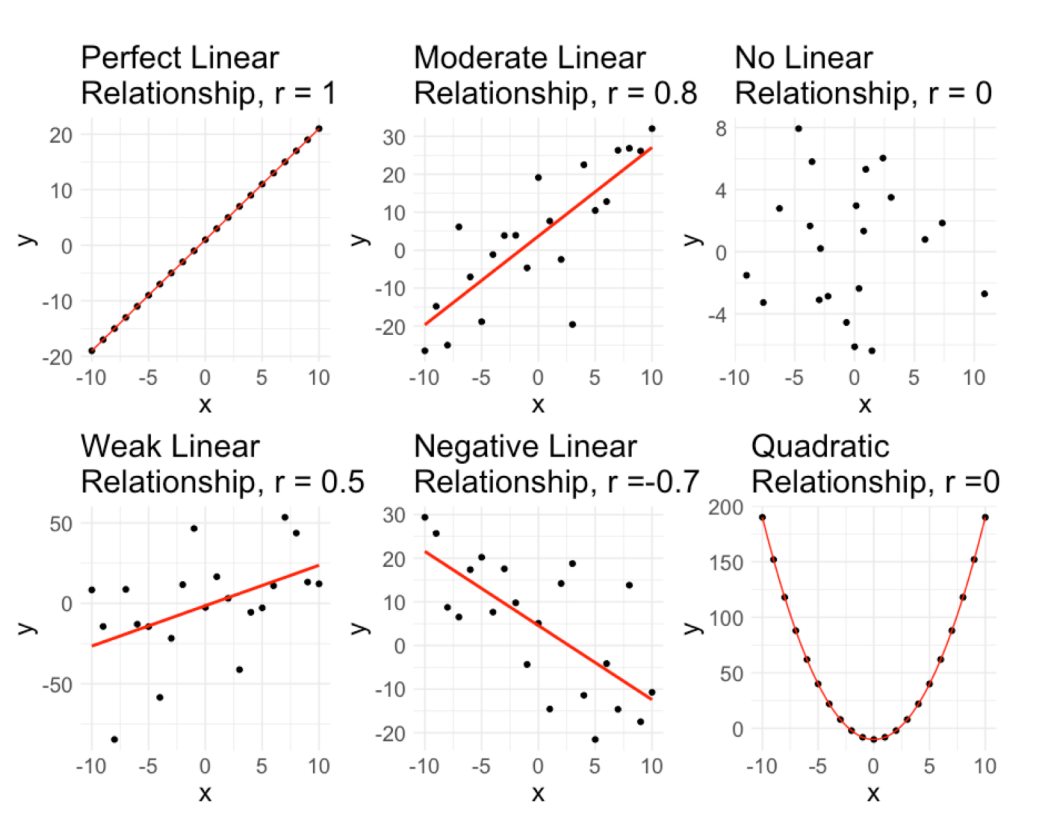
When evaluating a scatterplot by sight alone, it is sometimes difficult to determine the strength of the relationship. One can describe it as "appears to be a strong/moderate/weak relationship". When describing the strength based on the correlation coefficient the strength of the values are subjective as a general rule:
| Absolute value of R | strength of the relationship |
|---|---|
| 0 - 0.2 | Very weak |
| 0.2 - 0.4 | Weak |
| 0.4 - 0.6 | Moderate |
| 0.6 - 0.8 | Strong |
| 0.8 - 1.0 | Very strong |
Correlation and Causation
- It's important to note that correlation is not causation.
- Meaning that just because there is a correlation between two variables, does not mean that one is causing change in the other.
- A third or more variable/s may be influencing both variables.
- Unseen factors causing influence on both correlated variables creating misleading impressions of causation
- E.g. ice cream sales and drowning deaths rising are correlated, but this does not address the third variable; rising weather temperatures
- Establishing causation needs more evidence; controlled experiments are necessary to confirm if a cause and effect relationship exists
- Advanced analyses can be used in some circumstances
- Relying solely on correlations can lead to incorrect conclusions and inappropriate actions.