2C. Measures of Shape
Symmetrical Distribution
In symmetrical distribution, the two sides of a dataset mirror each other. When the observed values are truly symmetrical this is called normal distribution.
When a histogram is constructed on a set of values with normal distribution, the resulting columns form a symmetrical bell shape, hence the term bell curve.
Following is an example of a histogram with symmetrical distribution.
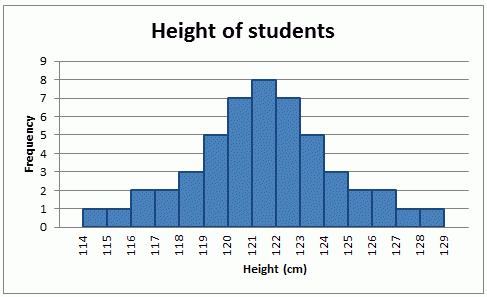
A dataset with normal distribution has the following key features:
- A symmetrical shape.
- The mean, median and mode are the same and are together in the centre of the curve.
- There is only one mode, thus only one most commonly occurring value.
- Most of the data is clustered around the centre, while the more extreme values on either side of the centre become less rare as the distance from the centre increases (i.e. About 68% of values lie within one standard deviation (
) away from the mean; about 95% of the values lie within two standard deviations; and about 99.7% are within three standard deviations. This is known as the empirical rule or the 3-sigma rule.
Asymmetrical Distribution
In an asymmetrical distribution the two sides will not be mirror images of each other. Skewness is the tendency for the values to be more frequent around the high or low ends of the x-axis. When a histogram is constructed for skewed data it is possible to identify skewness by looking at the shape of the distribution.
Measures of Shape
- Peaked, flat, or multimodal
- Outlier: a data point that stands well apart from the overall pattern
Source
Australian Bureau of Statistics. (2023, February 2). Measures of shape | Australian Bureau of Statistics. Retrieved June 25, 2026, from www.abs.gov.au website: https://www.abs.gov.au/statistics/understanding-statistics/statistical-terms-and-concepts/measures-shape